Examples of py1090
Recording messages to a file
This example reads BaseStation messages from a TCP server and writes them to a separate file if they contain position information.
import py1090

def record_positions_to_file(filename):
    with py1090.Connection() as connection, open(filename, 'a') as file:
        lines = 0
        for line in connection:
            message = py1090.Message.from_string(line)
            if message.latitude and message.longitude:
                file.write(line)
                lines += 1
                print("Recorded lines:", lines)

if __name__ == "__main__":
    record_positions_to_file("example_recording.txt")
An excerpt of a generated file looks like this:
MSG,3,111,11111,502C8F,111111,2015/05/01,20:28:11.080,2015/05/01,20:28:11.071,,33975,,,50.33498,5.93336,,,,,,0
MSG,3,111,11111,4B1619,111111,2015/05/01,20:28:11.348,2015/05/01,20:28:11.333,,33000,,,50.37995,5.95860,,,,,,0
MSG,3,111,11111,471F84,111111,2015/05/01,20:28:11.518,2015/05/01,20:28:11.466,,35000,,,50.64618,5.59360,,,,,,0
MSG,3,111,11111,4CA27D,111111,2015/05/01,20:28:11.549,2015/05/01,20:28:11.530,,21150,,,50.48991,5.92490,,,,,,0
MSG,3,111,11111,47875C,111111,2015/05/01,20:28:11.912,2015/05/01,20:28:11.859,,21125,,,50.82724,5.91695,,,,,,0
MSG,3,111,11111,471F84,111111,2015/05/01,20:28:11.978,2015/05/01,20:28:11.924,,35000,,,50.64595,5.59508,,,,,,0
MSG,3,111,11111,502C8F,111111,2015/05/01,20:28:12.020,2015/05/01,20:28:11.989,,33975,,,50.33592,5.93110,,,,,,0
...
These files usually are multiple Megabytes large.
Plotting paths on a Matplotlib Basemap map
This example takes an input file generated in the first example and plots the recorded paths on a map, using the mpl_toolkits.basemap module.
from mpl_toolkits.basemap import Basemap
import numpy as np
import matplotlib.pyplot as plt

import py1090

from example_helpers import map_bounds, blacklist_hexidents, example_data_file

def basemap_plot_positions(filename):
    m = Basemap(projection='merc', resolution='i', **map_bounds['europe'])
    m.drawcoastlines()
    m.fillcontinents(color='white', lake_color='white')
    m.drawcountries()

    collection = py1090.FlightCollection()

    #with py1090.Connection() as connection:
    with open(filename, 'r') as connection:
        collection.add_list(connection)

    for flight in collection:
        if flight.hexident in blacklist_hexidents:
            continue

        path = list(flight.path)
        if len(path) > 1:
            lats, lons, alts = np.array(path).T
            x, y = m(lons, lats)
            m.plot(x,y,".-")

    plt.title("Flights in file '{:s}'".format(filename))
    plt.show()

if __name__ == "__main__":
    filename = example_data_file()
    basemap_plot_positions(filename)
Creating a polar antenna plot using Matplotlib
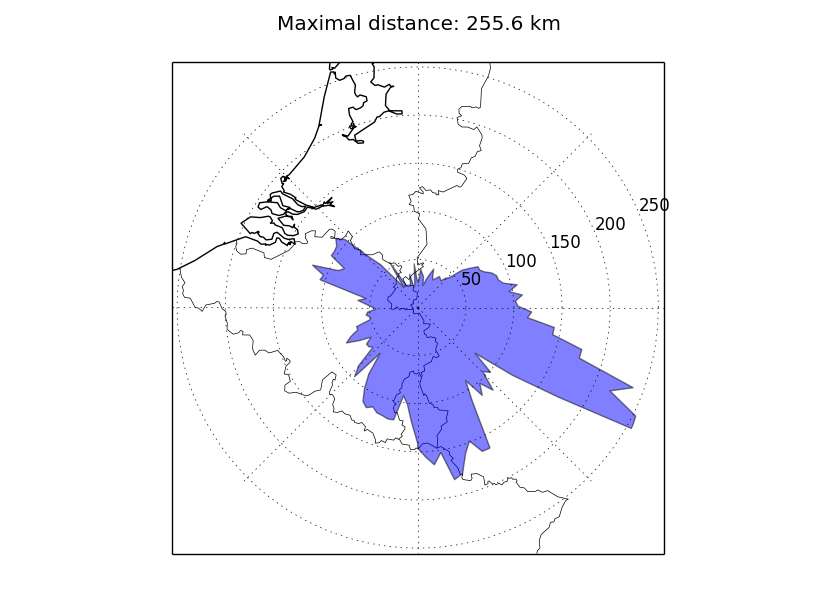
This example takes an input file generated in the first example and plots the maximum distances in each direction, also using the mpl_toolkits.basemap module.
import os.path
import math

from mpl_toolkits.basemap import Basemap
import numpy as np
import matplotlib.pyplot as plt

import py1090
from py1090.helpers import distance_between, bearing_between

from example_helpers import calculate_map_bounds, blacklist_hexidents, example_data_file

def basemap_plot_distances(filename, home):
    # number of sections
    N = 120

    bins = np.zeros(N)

    collection = py1090.FlightCollection()
    #with py1090.Connection() as file:
    with open(filename, 'r') as file:
        collection.add_list(file)

    for flight in collection:
        if flight.hexident in blacklist_hexidents:
            continue

        for lat, lon, alt in flight.path:
            bearing = bearing_between(home[0], home[1], lat, lon)
            distance = distance_between(home[0], home[1], lat, lon)

            if distance > 500e3:
                print("Warning: coordinates", lat, ",", lon, "sent by plane", flight.hexident, "are very far away, skipping for now, you may consider blacklisting though.")
                continue

            bin = round(bearing * N / (2*math.pi)) % N

            if distance > bins[bin]:
                bins[bin] = distance

    m = Basemap(projection='stere', resolution='i', lat_0=home[0], lon_0=home[1], width=bins.max()*2, height=bins.max()*2)

    fig = plt.figure()
    ax_map = fig.add_subplot(111)

    m.drawcoastlines()
    m.fillcontinents(color='white', lake_color='white')
    m.drawcountries()

    ax_polar = fig.add_axes(ax_map.get_position(), polar=True, frameon=False)
    ax_polar.set_autoscale_on(False)
    ax_polar.set_ylim(0, bins.max()/1000)

    ax_polar.fill(np.linspace(0, 2*math.pi, N) - math.pi/2, bins/1000, alpha=0.5)
    ax_polar.xaxis.set_ticklabels([])

    plt.title("Maximal distance: {:.1f} km".format(bins.max() / 1000))
    plt.show()

if __name__ == "__main__":
    filename = example_data_file()
    home = (50.775346, 6.083887)

    basemap_plot_distances(filename, home)